
Notifications 12
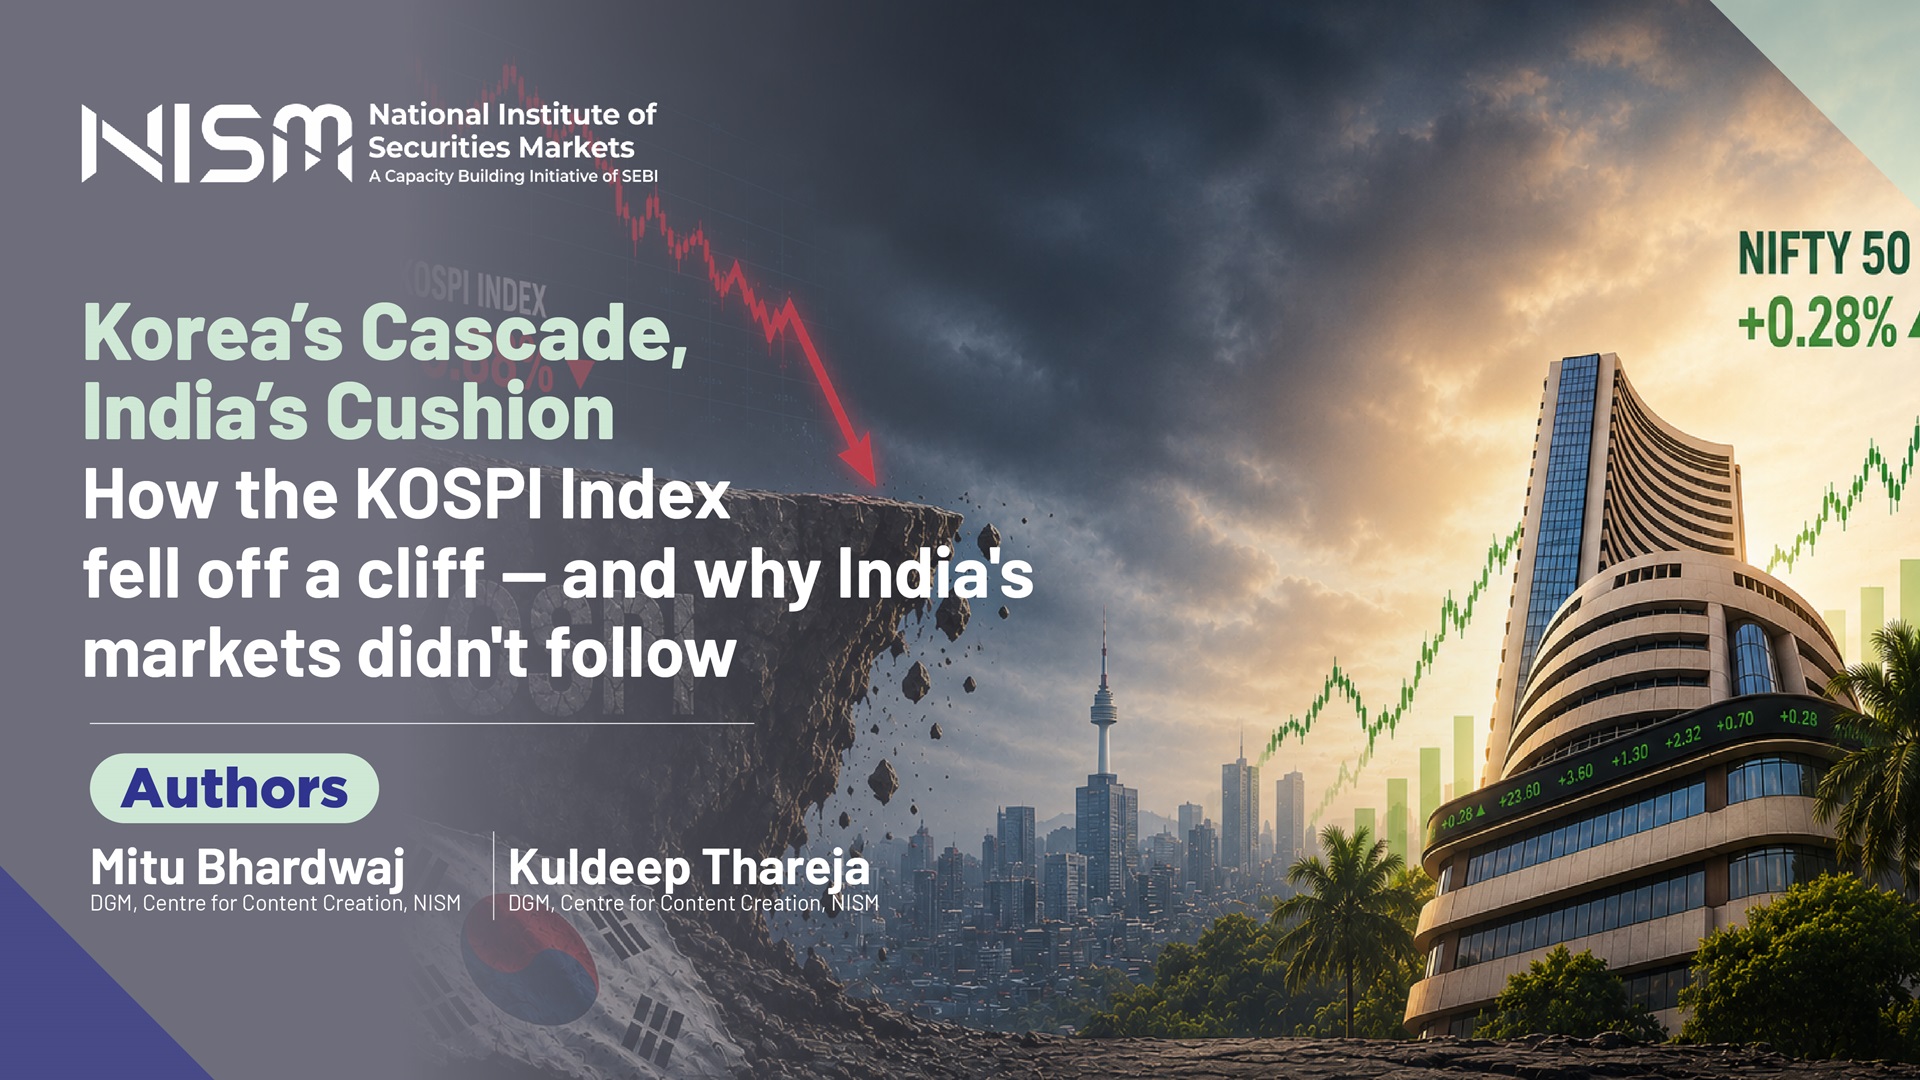
Between mid-June and late July 2026 the South Korean benchmark (KOSPI) staged one of the most violent reversals in its history. After hitting an all-time high of roughly 9,386 on 19 June 2026, the index shed close to 27% in a matter of weeks, with repeated single-session crashes of 8–11% that tripped the Korea Exchange’s automated circuit breakers. By late July the exchange had logged around eight market-wide circuit breakers and nearly thirty sidecar halts in a single year (a sidecar is a milder, five-minute brake that suspends only automated program trading when index futures swing about 5%, whereas a circuit breaker halts the entire market) — surpassing the previous record set during the 2008 financial crisis. The slide was driven not by a single shock but by a combination of global macro pressures, sector-specific vulnerabilities, and deep structural weaknesses in Korea’s market. This piece examines those weaknesses, and contrasts them with the guardrails that have kept Indian markets comparatively orderly through the same global turbulence.
Extreme concentration in semiconductors. The KOSPI Index carries an unusually heavy structural tilt toward information technology and memory chips. Samsung Electronics and SK Hynix alone account for roughly 40–50% of the entire index. When global semiconductor sentiment cooled — amid missed earnings guidance from chipmakers and fears of AI-chip oversupply, sharpened by the rise of Chinese memory maker CXMT — these two stocks fell nearly 10–13% in single sessions and dragged the whole benchmark down with them. On the worst days, over 800 stocks declined against fewer than 50 that rose, showing how a two-stock problem became a whole-market problem.
Unwinding of leveraged AI positions. Through the AI rally, both retail and institutional investors amplified their bets on chip and tech names using single-stock ETFs and margin trading. As prices plummeted, forced liquidations and margin calls cascaded the downward spiral rather than cushioning it.
Global monetary policy and geopolitics. Stronger-than-expected U.S. data revived fears that the Federal Reserve would keep rates higher for longer. Combined with unexpected moves from the Bank of Korea and heightened friction in the Middle East, foreign capital exited Korean equities rapidly, adding currency pressure to the equity rout.
The same global forces, the AI-chip wobble, persistent higher U.S. Fed rates, an oil-price scare, and a firm dollar struck Indian equities too. Yet the Nifty 50 Index and BSE Sensex moved close to flat, absorbing dips and recovering quickly, with no market-wide trading halts. Two structural features and a layered regulatory framework explain the difference.
Unlike Korea’s dependence on memory chips, India’s benchmarks are spread across roughly 13 sectors. Financial services is the single largest block at around 36%, followed by oil & gas (9.6%), Information Technology (8.37%), automobiles (7.13%), and consumer goods (5.7%), with no single stock dominating. Because the exposures are genuinely diversified, weakness in Indian IT was routinely offset by strength in banking, autos, or infrastructure, so no single theme could take the whole index down.
2- A domestic institutional backstop funded by SIPs
India’s flow dynamics have shifted structurally. In the first half of the year Domestic Institutional Investors (DIIs) net-bought a record ₹4.3 lakh crore of Indian equities while Foreign Institutional Investors (FIIs) net-sold around ₹2.7 lakh crore. On individual panic days, DII buying repeatedly exceeded FII selling (for example, ₹9,283 crore of DII buying against ₹6,690 crore of FII selling over June 9–10, 2026). DII ownership has now structurally overtaken foreign ownership. As per NSE’s India Inc. Ownership Tracker data, DII ownership of NSE-listed companies surpassed their FPI counterparts. This reduces the “hot money” share of the market as SIP investors do not panic exit en masse.
Beyond market structure, SEBI and the exchanges (NSE and BSE) have built multi-layered rules that actively limit concentration and speculative leverage before they can destabilise the market:
Index concentration norms. Since 2019, SEBI has required any index underlying an ETF or index fund to hold at least 10 stocks, cap any single stock at 25% (35% for sectoral/thematic indices), and limit the top three constituents to 65% combined. This directly forbids the kind of two-stock, 40–50% concentration that hollowed out the KOSPI Index.
Real-time margining. Brokers must collect upfront (peak) margins before execution, and positions are marked-to-market continuously. This prevents the build-up of unchecked leverage of the sort that triggered Korea’s cascade of margin-call liquidations.
Circuit breakers and price bands. Market-wide circuit breakers (at 10%, 15%, and 20% index moves) and scrip-level price bands halt runaway moves in an orderly way.
ASM and ESM surveillance. The Additional and Enhanced Surveillance Measures, introduced in 2018, let SEBI flag stocks showing unusual volatility, concentrated client trading, or suspicious price-volume patterns. Flagged stocks face 100% upfront margin and curbed intraday leverage — curbing speculative froth before it turns systemic.
Korea’s fall was not simply bad luck; it was the predictable failure of a market concentrated in two stocks, one theme, and leveraged, foreign-heavy flows. India faced the same global shocks but was cushioned by genuine sectoral breadth, a deep and non-panicky domestic investor base built on SIPs, and a stack of SEBI rules that cap concentration and leverage by design.
Disclaimer: Views are personal.
Authors: Mitu Bhardwaj and Kuldeep Thareja DGMs, Centre for Content Creation, NISM
Last Updated on: September 3, 2026 The minds inside a derivatives account SEBI’s Department of Economic and Policy Analysis has…
A Yen Rescue Dressed in Euros Washington’s intervention was ingenious in its plumbing and silent on the flows that matter…
The Closing Auction Needs Attendance, Not a Rethink A well-attended closing auction benefits investors by lowering trading costs, providing a…
© 2026 National Institute of Securities Markets (NISM). All rights reserved.
