
Notifications 12

From April, 2025, AMCs will be required to include Risk Adjusted Return information as part of the fund performance statistics they publish. Till now, AMCs were required, by regulation, to disclose scheme returns vis-à-vis the benchmark returns (TRI) in terms of Compounded Annual Growth Rate (CAGR) across various time periods.
CAGR is a very useful performance statistic as it represents the mean annual growth rate of an investment over a specified time period, assuming that the investment has grown at a steady rate. It reflects the compounding effect of growth over time. It is therefore far superior to average returns, especially in times of volatility, as average returns is a simple mean of the annual returns over the time period.
To help investors make better decisions, AMCs will now have to additionally disclose the Information Ratio (IR) of equity funds – a ratio that measures the Risk Adjusted Returns of the funds. The IR measures the excess returns of an investment relative to its benchmark, adjusted for risk. The IR is calculated as the ratio of the excess returns to tracking error, where excess returns is the difference between the portfolio returns and the benchmark returns, and the tracking error is the standard deviation of the excess returns. The IR provides a clear indication of how well the fund is performing relative to the benchmark and a positive and higher IR suggests better performance. The following illustration will help investors understand how to interpret both CAGR and the Information Ratio. The hypothetical performance statistics of two funds – Fund A, Fund B – and their benchmark – are given in the table below –
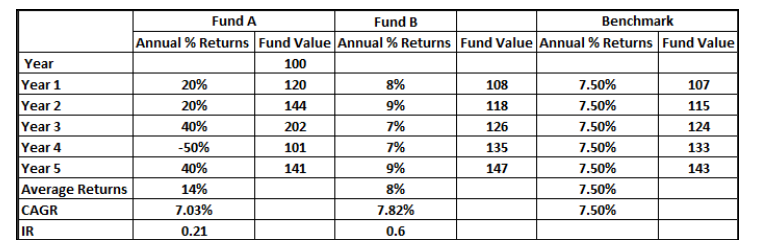
While Fund A has delivered significantly better returns (when seen on Average Returns basis), there have been wild swings in the returns, year on year. Fund B has delivered more consistent returns, year on year, and hence the CAGR for Fund B is better than Fund A. Not only that, the CAGR of Fund A is lower than the benchmark CAGR and Fund B has outperformed the benchmark. An easier understanding can be had by looking at the fund value at the end of 5 years, where Fund B has a higher fund value than both the benchmark as well as Fund A. The higher positive IR for Fund B indicates that it generated excess returns over the benchmark after adjusting for risk and that it has performed better compared to Fund A on a risk adjusted basis. With AMCs now required to make these additional disclosure, mutual fund investors will surely benefit.
Sashi Krishnan
Director, NISM
This article was part of the April 2025 NISM Newsletter. Click here to view the Newsletter: https://www.nism.ac.in/newsletter-2025/

Last Updated on: September 3, 2026 The minds inside a derivatives account SEBI’s Department of Economic and Policy Analysis has…

A Yen Rescue Dressed in Euros Washington’s intervention was ingenious in its plumbing and silent on the flows that matter…

The Closing Auction Needs Attendance, Not a Rethink A well-attended closing auction benefits investors by lowering trading costs, providing a…
© 2026 National Institute of Securities Markets (NISM). All rights reserved.
