The Buyback Mirage – How EPS Gets a Cosmetic Lift – Real EPS Growth vs. Finance Magic
Corporate share buybacks are back in the headlines. In 2025, U.S. companies announced buybacks exceeding about $1 trillion by August, led by technology and financial majors. India has seen activity too: listed firms repurchased roughly ₹48,000–49,000 crore (~$5.8 billion) in 2023 and about ₹13,500 crore (~$1.6 billion) in 2024, with large, cash-rich companies like Infosys undertaking repeated programmes. These figures sound impressive, and buybacks often lift stock prices in the short run. But the finance behind them is subtle. This note explains, in simple terms, why buybacks can create an artificial sense of earnings growth, why valuations sometimes rise on optics rather than economics, and why reinvestment, especially in growing markets like India, usually drives superior long-term results.
What a buyback actually does
When a company buys back its own shares, it reduces the number of shares outstanding. Mathematically, earnings per share (EPS) increase even if total profit does not change. If a firm earns ₹10,000 crore and has 1,000 crore shares, EPS is ₹10. After a 5% buyback (share count falls to 950 crore), EPS becomes ~₹10.53 without any improvement in sales, margins or cash flows. Price/earnings (P/E) can appear cheaper, and the stock may rise. But the operating engine is unchanged.
From a corporate-finance lens, this is a payout decision just like a dividend, but executed by purchasing shares rather than sending cash to bank accounts. Under the famous Modigliani–Miller logic (perfect markets, no taxes, no frictions), payout form does not create value; only positive-NPV investments do. In the real world, taxes, signalling and market microstructure matter, so buybacks can have effects—but these are essentially distribution mechanics, not value creation by themselves.
EPS growth vs economic growth
Analysts should separate accounting ratios from economic value:
Economic value rises when the company adds future free cash flows by launching products, expanding capacity, improving productivity or building moats.
EPS rises in a buyback because the denominator (share count) shrinks. This is arithmetic. It can be helpful, but it is not the same as growing the enterprise.
A cleaner lens is the value growth equation:
Long-run growth (g) ≈ Reinvestment Rate × Incremental ROIC (return on invested capital).
If a company stops reinvesting and returns most cash via buybacks, its reinvestment rate falls. Unless incremental ROIC was low or opportunities were absent, that decision lowers g. If the market valuation still assumes high growth (say 10–12%), the P/E today embeds reinvestment that may never materialise. In time, the share may face a de-rating when reality catches up.
Why buybacks can appear to “work”
Three forces make buybacks look powerful:
Float reduction and index mechanics. Reducing free float creates scarcity and can increase a company’s weight in indices, attracting passive flows. Prices rise because supply falls, not because future cash flows increase.
Tax preference. In the U.S., capital gains tax is deferred until sale, whereas dividends are taxed when paid. This pushes boards to favour buybacks. (Tax treatment differs by country and can change.)
Low-rate funding (last decade). When borrowing costs were very low, some firms levered up to buy back stock, which boosted EPS faster than organic growth could, especially in the U.S.
None of these forces guarantees sustainable value creation. They improve per-share optics and sometimes short-term returns, but they do not, by themselves, expand the company’s productive capacity.
India’s context: a reinvestment market
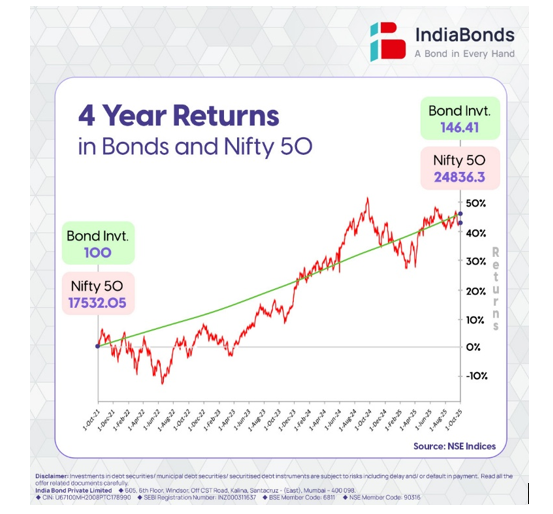
India remains a growth market, with opportunities arising from formalisation, infrastructure, manufacturing, digitisation, and rising consumption, where incremental ROIC can exceed 15-20%. In such an environment, every rupee retained and reinvested in the core business can compound intrinsic value faster than a rupee spent on buybacks, especially when share valuations are already rich.
The local data are instructive. Buyback totals of about ₹48,000–49,000 crore (~$5.8bn) in 2023 and ₹13,500 crore (~$1.6bn) in 2024 are meaningful, yet small relative to India’s capex cycle and funding needs. Several large firms have conducted repeated buybacks; cumulatively, some programmes (e.g., in IT services) run into tens of thousands of crores (~$4-5bn). These are legitimate ways to return cash, but for high-ROE/high-ROIC businesses with a long runway, reinvestment usually dominates over time.
When buybacks make sense and when they don’t
In corporate-finance terms, capital allocation follows a hierarchy:
Fund all positive-NPV projects in the core business (organic capex, R&D, product development).
Consider M&A only if it passes strategy and return hurdles.
Return surplus cash via dividends or buybacks only after (1) and (2) are satisfied.
Price discipline for buybacks is critical: repurchases add value only when the stock trades below intrinsic value. Buying at 35–40× earnings in a high-ROE firm can be value destructive relative to reinvesting at 18–20% ROIC.
Avoid debt-funded buybacks unless leverage remains conservative under stress. Raising debt to retire equity reduces equity cushion and can increase risk if rates rise or cash flows weaken.
For beginners: think in NPV. If the IRR on reinvestment is comfortably above the cost of capital, keep building. If not, return cash, and if buying back, ensure the repurchase price < intrinsic value. EPS accretion is not the test; per-share intrinsic value accretion is.
The valuation illusion
High-quality businesses often command premium multiples because investors expect sustained reinvestment at high incremental returns. If management instead runs large buybacks year after year, the company’s reinvestment rate quietly falls. Growth slows from, say, 12% to 4-5%, yet the stock might still trade at a multiple that assumes 12%. For a while, the EPS still rises (because share count falls), and valuation holds up. Eventually, the market notices the slower engine and the multiple compressions. The earlier outperformance then looks artificial, driven by accounting arithmetic and multiple support, not by true expansion of cash flows.
How other markets compare
United States: The world’s most buyback-heavy market. Large, consistent programmes have contributed materially to per-share EPS growth and index performance over the past decade. Supportive factors were tax treatment, deep credit markets, and abundant passive flows.
Europe: Buybacks have grown, but are more varied by country and sector, with banks and consumer firms increasingly active in recent years.
Japan: Reforms in corporate governance and pressure to improve capital efficiency have encouraged rising buybacks and cancellations, alongside higher dividends.
Emerging markets (ex-India): Activity is uneven; many companies still focus on capex-led growth and balance sheet strengthening.
The common theme is that buybacks are most celebrated in situations where mature businesses generate cash faster than they can find high-return projects. In younger, faster-growing economies, reinvestment typically delivers better compounding.
High-ROE is not a licence to repurchase
A frequent misconception is: “Our ROE is 20%+, so buybacks must be great.” Not necessarily.
Buybacks can inflate ROE because the equity base (denominator) shrinks. Profit may be flat, yet ROE rises.
Opportunity cost matters: if you can deploy ₹1,000 crore at 18–20% incremental ROIC, that beats retiring shares at 40× earnings (a 2.5% earnings yield).
Resilience matters: cash used today is unavailable for downturns, platform investments, or strategic acquisitions tomorrow.
The correct question is not, “Will the buyback raise EPS?” It is, “Does the buyback raise intrinsic value per share more than the next best use of cash?”
A simple checklist for investors and students
Track the drivers: Are revenue, operating profit and free cash flow growing, or is EPS doing all the heavy lifting?
Estimate organic growth using g = Reinvestment Rate × Incremental ROIC. If buybacks are large, ask whether g is being diluted.
Check price discipline: At what multiple is the company repurchasing? A buyback above intrinsic value transfers wealth from continuing to selling shareholders.
Watch leverage and interest cover when buybacks are debt-funded.
Could you read the capital-allocation framework in annual reports and investor letters? Good managers explain the order of cash uses and the hurdles for each.
India’s edge: compounding through reinvestment
For India, the message is clear. We are in a multi-year cycle of capex, formalisation and productivity gains. Many companies can still reinvest retained earnings at attractive rates. That makes reinvestment the first call on cash, not buybacks. Of course, if a stock is trading well below intrinsic value, a measured buyback can be value-accretive after growth projects are funded and balance sheet strength is preserved.
The message behind the scenes
Buybacks are a tool, not a strategy. They are excellent when they transfer cash to shareholders at the right price and after funding high-return growth. But they do not create new cash flows by themselves. Markets that rely heavily on buybacks may show strong per-share optics and higher valuations. Yet, part of that return is manufactured by arithmetic and scarcity, not by expansion of the economic engine. Markets that prioritise reinvestment at high incremental returns—like India today—tend to deliver truer, more durable compounding.
Invest where the next rupee earns more than the last. EPS can be engineered; intrinsic value must be built.
Author:
Mr. Biharilal Deora, Director @ Abakkus Asset Manager